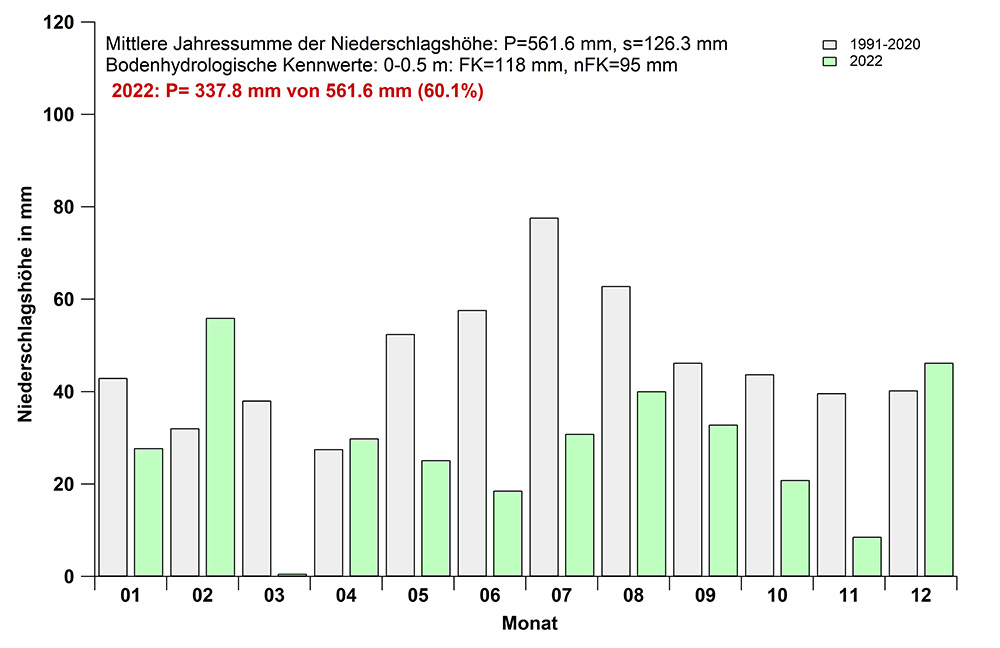
For the object of the month August, we have chosen the diagram of the precipitation in Berlin-Dahlem for the year 2022 (Fig. 4), which is a piece of the daily weather observation. Morever it also reflects the diversity of research at the Humboldt-Universität zu Berlin as well as allowing the connection to current debates such as climate change and questions of future food security. It is therefore about the one topic where everyone surely always wants to form an opinion: the weather.
The terms weather and climate should be kept apart. Weather describes the measurable instantaneous state of the atmosphere, whereas climate is defined more as a typical recurring annual pattern of weather, usually based on 30-year averages.
Weather is usually associated with sunshine, wind, rain or temperature. These are variables that can be measured or counted and play a central role, especially for agriculture and thus for food. And in order to be able to measure or count them professionally, there are fixed weather stations, which are also located at Humboldt-Universität.
The agro-climatological weather station at the agricultural experimental site in Berlin-Dahlem was established in 1931. The weather data measured since then is used on the one hand for the evaluation of the permanent agricultural experiments at the site (investigation of the relationships between weather patterns and growth, development and yield formation of agricultural crops) and on the other hand for the evaluation of the most diverse field experiments, which are designed to be more short-term. The data is available to all students and staff for the evaluation of their field trials.
In addition, the long-term weather records provide an insight into the climatic changes in Berlin.
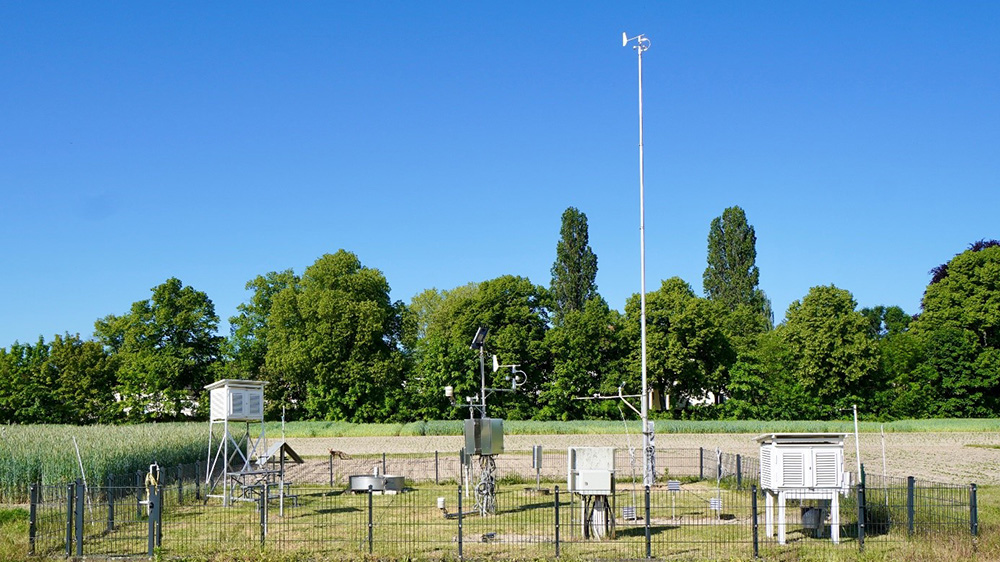
Figure 1: Weather station on the grounds of the permanent field experiments of the Department of Crop and Animal Sciences of the Thaer Institute of Agricultural and Horticultural Sciences in Dahlem. (Photo: O. Zauzig 2023)
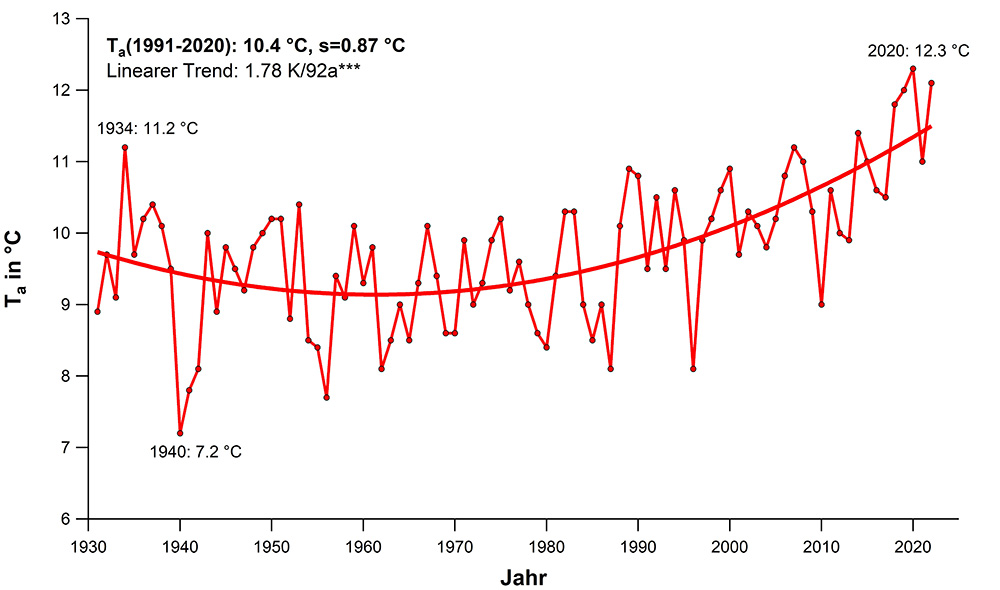
Figure 2: Course of the annual mean air temperature (Ta) since the beginning of weather recording in Dahlem.
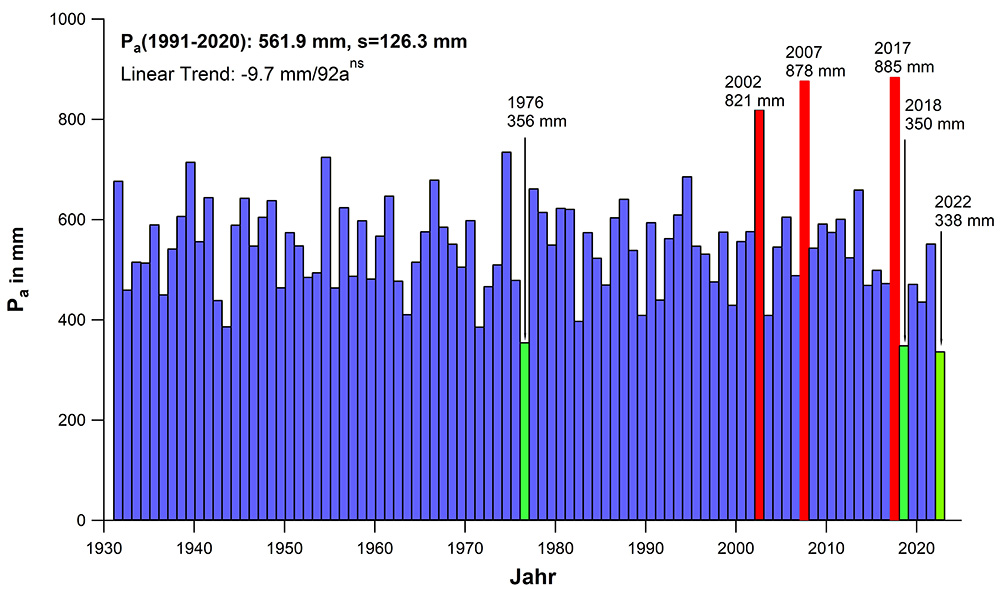
Figure 3: Annual precipitation (Pa) over the same period.
The two graphs show the course of the annual mean air temperature and the annual precipitation depth (both y-axis) from 1931 to 2022. The air temperature in Berlin-Dahlem increased significantly by 1.8°C between 1931 and 2022 (1.78 Kelvin in 92 years). Annual precipitation shows no significant trend, with the lowest annual precipitation to date of only 338 mm (equivalent to 338 litres per square metre) measured throughout the year in 2022.
Figure 4: Course of precipitation depth in 2022, measured at the Dahlem site.
Figure 4 shows that only 3 months of the year (February, April, December) had precipitation levels above the long-term average. This led to an annual precipitation deficit of 40 percent and thus to the lowest annual total of 337.8 litres per square metre since observations began in 1931. With only 0.6 l/m² precipitation, March 2022 also set a record, which was due to the highest sunshine duration of 245.3 hours measured to date.
This means that four records were set at once in 2022: highest sunshine duration and lowest precipitation level in March, lowest annual precipitation level since 1931, highest number of “desert days”.
Observing the weather remains our task.
Authors: Prof. Dr. Frank-M. Chmielewski and Dr. Oliver Zauzig